NIFTY 50 analysis for Tuesday ❗Hii Traders 😊 ,
Welcome to NIFTY 50 Futures and options analysis for intraday trading ......................
🛑 Nifty will be stronger above 18000 zone which crucial resistance zone if failed to close above that zone then we can see some correction in market it may can test the 17000 levels This will be crucial for nifty to sustain above the level until then market will be weaker
🛑 Currently it is trading above 21Day ,50 Day, 100 Day moving averages
🎯 Key levels to watch out intraday levels for day trader
🛑 Major resistance zone for Nifty is at 17760-17790
◽ If market breakout resistance zone then we can see Target of 17880 as first target (if we see the Option chain data here 17800 CE holds more short position and next strike is 18000CE)
◽ Stop loss for this level is 17700
🛑 Major support level for Nifty 50
◽ Support level for nifty lies at 17530-17500
◽ If breakdown happens we can see the 1st Target of 17400
◽ stop loss ie .17580
🛑 levels for Nifty Futures will be as follows
◽ Go long on nifty Futures if it breakout our resistance
◽ Don't short the market until below the 17500
◽In between range is indecisive don't go long or short anything can happen
🛑 Tradeshots
◽ Resistance level for CE buyers /option buyers is at 17760-17790
◽ support zone to buy PUT / PE is at 17530-17500
◽ Nifty will be weaker on intraday basis below the 17500
Thanks for reading,
If you like it do follow for more and give reputation which will boost mine confidence to do more.
have a nice day 😊
Search in ideas for "NIFTY 50"

Nifty 50 Daily Chart Analysis as of February 22, 2024Nifty 50 Daily Chart Analysis as of February 22, 2024
Overall:
The Nifty 50 closed at 22,217.45 on February 22nd, 2024, gaining 0.74% from the previous day's close.
This is the highest closing since February 8th, 2024.
Despite the positive close, the index remains below its 200-day moving average (around 22,400), indicating a possible resistance level.
Key Technical Indicators:
Moving Averages:
The 50-day moving average is currently at 21,850, acting as support.
The 200-day moving average is at 22,400, acting as resistance.
Relative Strength Index (RSI): The RSI is currently at 53.5, indicating the market is neither overbought nor oversold.
MACD:
The MACD is currently above the signal line and positive, indicating potential for further upside momentum.
Recent Price Action:
The Nifty 50 has been on an upward trend since February 15th, gaining over 1.3%.
This upward trend is supported by positive news flow, such as the RBI's decision to maintain a dovish monetary policy.
Important Notes:
This is not financial advice and should not be considered as such.
Past performance is not necessarily indicative of future results.
It is important to do your research before making any investment decisions.
Additional Considerations:
Global market sentiment can significantly impact the Nifty 50.
Upcoming economic data releases and corporate earnings reports can also influence the market.
Overall, the Nifty 50 is currently in an upward trend, but there are some potential resistance levels ahead. Investors should carefully consider all relevant factors before making any investment decisions.
I hope this analysis is helpful. Please let me know if you have any other questions.

Nifty 50 Intraday Trade Setup for Tuesday 28th April 2020Good Morning sir's,
First aspect my apologies for not posting the Intraday Trade setup for Nifty 50 and Bank Nifty Index both.We had seen a narrow range in Nifty 50 Index , Most of come from gap up and Index traded btw 9380 to 9250. This range is valid for today as well and an Indecision. SGX and Onanada both has shown the strength in Nifty future while we're selling so most of chances for a gap up opening.
Key Factors
===============
1-Reserve Bank of India (RBI) announced a special liquidity facility of Rs 50,000 crore for mutual funds to calm investors jittery after the Franklin Templeton fiasco.
2- Dow has also shown strength and closed 358.5 Point up from previous trading session.
3- Crude Oil is still weak.
4- Indian rupees are stable
5- According to Option chain data Nifty Range will be 9000-9500
Nifty key Resistance for Intraday is 9500 and support is on 8900 as per my own tech analysis...
Intraday Trade setup
======================
Buy : Only and only when nifty cross 9450 and sustain first hour above on it.
Sell : Short Position is tricky and I am getting 2 levels
A: First Position come from 9370-9400 with 9450 sl . If you see any gap up Opening then you can build your short position here .. For : aggressive Traders
B: Safe Trader can build their short lower then 9140
Good Luck and Happy trading

Nifty 50 Analysis for 14-08-2024: Support & Resistance LevelsOn August 13, 2024, the Nifty 50 index experienced a volatile trading session, closing at 24,100, marking a decline amidst broader market weakness. The index opened at 24,320, reached a high of 24,400, and saw a low of 24,050 during the day, before ending the session with a loss.
The Indian stock market faced additional pressure due to a new report from Hindenburg Research, which leveled serious allegations against the SEBI Chief. This news created uncertainty in the market, leading to cautious trading and profit-booking, particularly in the financial and IT sectors. The impact was evident in the market's muted performance, with many investors staying on the sidelines awaiting further developments.
Technical Indicators for Nifty:
Max Pain: 24,200
PCR (Put-Call Ratio): 0.53 Bearish
IV (Implied Volatility): 16.90 as of the closing on 13-08-2024.
Support Levels
Nifty is likely to find support around 24,000.
Resistance Levels
The Nifty is expected to face immediate resistance around the 24,300 to 24,400 mark.
Top Gainers:
Adani Enterprises and Tata Motors emerging as the top gainers. Adani Enterprises closed at ₹2,417.50, marking a 2.5% increase, while Tata Motors ended the day at ₹621.80, up by 1.8%.
Top Losers:
HDFC Bank and Infosys were the top losers, reflecting the broader market's cautious stance. HDFC Bank's share price dropped by 3.2% to ₹1,615.20, and Infosys fell by 2.9% to ₹1,358.40, largely due to concerns about margin pressures and global economic uncertainties.
Open Interest (OI) Analysis and Technical Indicators:
The Open Interest data for Nifty 50 options on August 13 showed a significant buildup at the 24,000 strike price, indicating strong support at this level. Meanwhile, resistance was observed around 24,400, where considerable call writing occurred. Technical indicators for the Nifty 50 suggested a bearish trend, with the Relative Strength Index (RSI) hovering around 40, signaling potential weakness. The Moving Average Convergence Divergence (MACD) also pointed to a bearish crossover, further reinforcing the negative outlook.
Stay tuned for more updates on Nifty prediction to navigate the volatile market conditions effectively.
Disclosure: The publisher of this idea is not a SEBI registered analyst. The information shared here is solely for educational purposes and should not be interpreted as financial advice. Always consult with a qualified financial advisor before making any investment decisions. The publisher does not endorse social media shares on any platform.

Nifty 50 Analysis for 08-08-2024: Support & Resistance LevelsThe Nifty 50 index had a positive session today, opening at 24,287.80 points and closing at 24,297.50 points, marking a gain of 1.27%. The index reached an intraday high of 24,336.25 and a low of 24,186.20. This performance was driven by broad-based buying across various sectors, with significant contributions from ONGC, Coal India, Adani Enterprises, and Adani Ports, which saw gains of up to 7.45%. The broader market indices exhibited impressive performance today, with the Nifty Next 50 leading the charge with a 3.01% increase. Following closely were the Nifty SmallCap 100 and Nifty MidCap 100, both showing significant upward movement.
Support Levels
The Critical support zone to watch is 24,000 - 23,900 if breached 23,800 will act as strong support.
Resistance Levels
24,350 will act as initial hurdle for the Nifty if crossed next hurdle is at 24,500.
Open Interest (OI) Analysis
Call Options:
Significant call writing observed at the 24,500 and 25,000 levels, indicating strong resistance as traders expect the index to face difficulty crossing these levels.
Put Options:
Major put writing at the 24,000 and 23,800 levels suggests these are strong support zones, with traders expecting the index to hold above these levels during any downward move.
Technical Indicators for Nifty 50:
Max Pain: 24,300
PCR (Put-Call Ratio): 0.70 Bearish
IV (Implied Volatility): 17.40 as of the closing on 07-08-2024.
RSI (14): Neutral at 50.398, indicating no extreme overbought or oversold conditions.
MACD: Shows a sell signal, suggesting possible downside pressure.
Market Sentiment and Expiry Impact
The market is expected to be volatile due to the weekly expiry. Traders should be cautious and watch for reactions around the key support and resistance levels mentioned. Profit-taking could occur at higher levels, particularly if the index fails to break through significant resistance zones.
Stay tuned for more updates on Nifty prediction to navigate the volatile market conditions effectively.
Disclosure: The publisher of this idea is not a SEBI registered analyst. The information shared here is solely for educational purposes and should not be interpreted as financial advice. Always consult with a qualified financial advisor before making any investment decisions. The publisher does not endorse social media shares on any platform.

NIFTY 50, MARKET TREND!!INDIA WILL ALWAYS BE THE BEST INVESTMENT AT ANY ANY TIME. NIFTY 50 IS A GREAT INDICES TO BE INVESTED IN.
many of them ask will nifty 50 cross 18000 again this year, i say yes, and even say yes for one more question: will nifty 50 be still bullish in 2023.
there are many reasons of it, and i have covered it in my previous analysis(check the lin section).
i have drawn out the support and resistance based on the markets getting consolidated.
look at the FIBONNACCI RETRACEMENT, how greatly nifty 50 is respecting towards it.

NIFTY 50 Levels for 29th Wednesday ❗❗Hii Traders 😊
Welcome to NIFTY 50 levels for intraday trading
🛑 Nifty shown weakness in today's market
🛑 If see day frame chart we can observe one single Red candel which is covered almost last 3 day' trading session
🛑Which means sellers were aggressive in the market but buyers were to try to pull back things
🛑It taken the support at 17600 I'm repeatedly saying that it will be good support zone it taken support and try to pull back the things
🛑If we see the Day volatility it is about 0.94% which higher for index
🎯 Key levels to watch out intraday levels for day trader
🛑 Major resistance zone for Nifty is at 17940-17970 where at this point nifty tried to breakout this level
◽ If market breakout resistance zone then we can see Target of 18100
◽ Stop loss for this level is 17870 here the pivot point control region
◽markett will shown some weakness if it traded below 17700
🛑 Major support level for Nifty 50
◽ Support level for nifty lies at 17600-17560
◽ If breakdown happens we can see the 1a
st Target of 17430
◽2nd target will be 17320
◽ stop loss ie .17660
If market traded below this level I'm sure market will be weak on intraday basis
◽ For nifty their strong support at 17560-17600 if this zone is breakdown then we will enter into range bound market or short term correction ( consolidation) period for some days
🛑Stay light on your quantity
🛑 levels for Nifty Futures will be as follows
◽ Go long on nifty Futures if it breakout the resistance 17920-17950
◽ If nifty traded above 18100
◽If market traded above 18000 then shorter's will run for covering
◽ Don't short the market until below the 17700-17600 levels
🛑 Tradeshots
◽ Resistance level for CE buyers /option buyers is at 17940-17970
◽ support zone to buy PUT / PE is at 17600-17560
◽ Nifty will be weaker on intraday basis below the 17700
Thanks for reading 😊
I hope that it will help a lot and if I'm wrong kindly comment mine mistake surely I will correct it
If you like it do follow for more and give reputation which will boost mine confidence to do more.
have a nice day 😊

Nifty 50 weekly forecast & Intraday setup for 05th October 2020Hello friends,
Hope you guys have done good in the last week and made some good money from the trading. I had seen that lot of peoples want to trade in Nifty and Banknifty Index just because of the volatility. I do agree that Index always has an opportunity for a knowledgable trader but the worst part is Index momentum is very hard to predict in the Intraday and you must follow the discipline more than any analysis. September is always a nightmare for Nifty 50 as per the last 3 year data. very volatile as we had seen recently. Total 1800 Points movement we had seen in the September month which is shown how many indexes volatile these days. Let's Investigate what was happened in September month.
Before the September Index was so bullish and making higher high and breaking most of the resistance but we had given you 10,750 level for a correction. This level has come from the harmonic and worked very well. The index has given 1000 Point downside move and made a low 10,790. Tou can see our 31st august analysis on the trading view. We predicted most of the major moves. I am gonna update all, check bellow images
Updated chart :
Then we predicted an upside move.
Updated chart :
Our last idea has been shared on Thursday and we pick Inda 50 for this analysis because Nifty 50 has not enough data. Check bellow Image
Updated chart :
These all our Past analysis and we have just updated them for your study purpose so you can believe that swing trading is far better than Intraday ... Now the main question is what gonna happen in October first trading week. Let's talk about key factors first.
Key Factors
==============
1-The Govt announced the launch of an ambitious information technology project 'Sunidhi' to digitize all provident fund and pension related activities of the Coal Mines Provident Fund Organisation.
2-India posted a trade deficit of $2.91 billion in goods in September. Merchandise imports contracted 19.60% in September to $30.31 billion from a year ago while exports rose 5.27% to $27.40 billion.
3-Automobile manufacturers showed significant signs of recovery as they dispatched 13% more vehicles to dealers in September. Tractor sales also increased, indicating that a good monsoon is driving the rural economy
4-NBFCs pin hopes on festive season for revival in credit disbursals. The collection efficiency of non-banking lenders and housing finance companies picks up.
5-India registered 79,705 new Covid-19 cases, taking the tally to 6,471,734. With a high level of recoveries, India was maintaining its global position as the country with the highest number of recovered Covid-19 patients.
6- An effective vaccine is not likely to be available for the general public before the fall of 2021, according to experts working in the field of vaccine development.
7- India’s economy posted its worst slump in the three months ended June as disruptions caused by the Covid-19 outbreak brought Asia’s third-largest economy to a halt. Economists expect growth to shrink in the year through March 2021, in the first such contraction in more than four decades.
8-Bringing huge relief to individual and MSME borrowers, the Centre told the Supreme Court that it would waive interest on the repayment of loans of up to Rs 2 crore. The move will provide relief to individual borrowers MSMEs during the COVID-19 outbreak. The waiver on interest would apply, irrespective of whether the borrower has availed of the moratorium in the categories of loans specified by the Govt. The waiving off interest on loans to every category would amount to a burden of Rs 6 lakh crore for banks.
9- Indian rupee, Crude oil is stable.
Weekly Trade Setup
====================
Nifty is trading on a major resistance area (11,500) and a correction is accepted.11,200 is the support area. This 300 Point range will decide Nifty Movement for this and for this month so keep an eye on both levels and set up your trade according to it .
Intraday Trade Setup for 05th October 2020
===========================================
As per Sgx nifty, we are going to see a huge gap down again so most of the levels based on previous data is Invalid now. We need to set up a fresh trade today. I suggest Use 30 Minute candle high low set up your trade. Wait first 30 minutes. Go in long if a high break or short if low breaks . Use less exposure on the buying side.
Major Intraday Resistance is 11,456 and major Intraday support is 11,300.
Disclaimer: I am not a SEBI Registered Research Analyst and all the information provided here is for educational purposes Views are shared based on market research and study and personal in nature. Others can take different views and opinions.
Good Luck and Happy Trading
Virendra Pandey

Nifty 50 Sell MoveThe NIFTY 50 is a benchmark Indian stock market index that represents the weighted average of 50 of the largest Indian companies listed on the National Stock Exchange. Nifty 50 is owned and managed by NSE Indices, which is a wholly owned subsidiary of the NSE Strategic Investment Corporation Limited. NSE:NIFTY

NIFTY 50, WAVES(THIS MONTH)!!although nifty 50 has crossed 18000 previously in its 3rd wave, it will reach its new all time high in 5th wave. nifty 50 is following the waves very greatly. i had previously drawn waves for bull run and updated you till 3rd wave. now here's an update for the 5th one.
i have explained each and every trend line , bull run in my previous nifty 50 analysis, and i will link it below, you will understand my analysis more understandingly, after reading the description of those analysis.
nifty is already in a bull run, this bull run is carried in 5 waves, and now we are in the last wave of it.
let see what happens after that...

Nifty 50 Intraday Trade setup for 8th June 2020Good Morning sweet peoples,
NIfty was damn bullish since 28th may and give an awesome really in the upside, 1000 point is just 10 days. Question is Can we trust on this bull run or it's just a bull trap only for retail investors. Well, a downtrend has never ended in just 2-3 months. The average cycle of a downtrend is 9-10 months and we learn this from history. Nifty major supply zone is 10,400 to 10,550 and we must keep an eye on this level. Let's talk first about the key factors which can affect today's trade setup.
Key Factors
======================
1-Moody’s downgrading India’s rating recently, Any further downgrade will make India susceptible to flight of capital and leave its currency vulnerable.
2-India went past Italy to become the sixth worst-hit nation by the Covid-19 pandemic. India saw a record single-day jump of 10521 coronavirus cases and 297 deaths on Saturday, pushing the nationwide infection tally to 2,46,622 and the death toll to 6,646.
3-Banking system credit down almost 50% from a year ago, reflecting the impact of the nationwide lockdown imposed at the end of March.
4-The coronavirus pandemic, which has presented challenges for several nations, could be an opportunity for India to speed up the health insurance scheme Ayushman Bharat, especially with a focus on primary healthcare. Pharma sector is still bullish
5-SGX nifty has given a good really in upside on Friday after our market closed and made a new high 10352. Currently trading on 10234 which is still high and we are going to see a Gap Up Opening today.
6- US30 Aka Dow also made a new high in the last 2 trading sessions almost 1000 point rally.
7- Asian market also seems bullish.
8-Foreign institutional investors (FIIs) poured in Rs 13,927.52 crore in cash markets (equity) in the first week of June, which was higher than Rs 13,914.49 crore invested in the entire May.
Technical View
=======================
SGX Nifty
-------------------
Let's talk first about SGX nifty. Our Index has not much enough data because of limited trading sessions. SGX almost trading on its supply zone. look the Bellow picture
India 50
----------------
Nifty 50 Index
===================
Our Nifty Future trade in 2 places and I mentioned both of chart above. NIfty Major Resistance area is 10,420 to 10,550 and we must keep an eye on this level. The support zone is 9,602. The index is trading in an uptrend channel and the channel resistance area is also on 10,400 to 10,500.
Trade setup
====================
Due to a gap up opening, most of the levels are destroy here so we will our 15-minute range strategy for today's trade setup. Wait for a 15-minute mark high and low of the candle and set up your trade according to it.
Disclaimer: I am not a SEBI Registered Research Analyst and all the information provided here is for educational purposes Views are shared based on market research and study and personal in nature. Others can take different views and opinions.
Good Luck and Happy Trading
Virendra Pandey

Nifty 50 analysisIt seems that Nifty 50 gonna slump soon after 18880-19000, after the downward channel breakout nifty in march Nifty 50 lifted up by 1200 points in just three months. Moreover, nifty is now creating an upward channel indicating a downward trend in upcoming couple of weeks. In addition, current level of nifty is profit booking level. the new levels for nifty after the breakout are 18400, 18200, 18000, and 17600. However, it will not happen in all of sudden but in few upcoming weeks or months. In my perspective, NIFTY current levels are great options for those who are looking for long term gains from short selling.

Nifty 50 Chart Analysis(Where can Nifty50 move on4th March 2024)Overview
Observing the current trend and movement of the Nifty index, it is evident that Nifty is showing signs of a bull market. On February 28, there was a period of panic selling that ended at the 21855 level, which is also our trend support level as shown in the linked chart. The Nifty index maintained a sideways movement on Thursday; however, during the final hour of trading, an uptick in buying activity was observed, resulting in a positive closure at 21982.Subsequently, on Friday morning, an excessive buying happened which led to a market closure at 22328.
Analysis
If the Nifty index breaches both the Resistance level and the Fibonacci Extension level, and subsequently maintains a sustained position above 22331, it is anticipated to ascend towards the levels of 22461 (130 rupees movementum) and subsequently 22625 (164 rupees movementum). Conversely, should it decline below the level of 22214 and sustain such a position, it is likely to descend towards the level of 2207 (174 rupees movementum), followed by 22020. Further, if this downward momentum persists beyond the aforementioned levels, the index is expected to decline towards the level of 21856 (164 rupees movementum).
Key points on Nifty 50 Chart Analysis.
Symmetrical Chart Pattern Analysis on Nifty50 Daily Time Frame
In analysing the Nifty50 on the daily time frame, a symmetrical chart pattern has been identified. As per this pattern, when the candle breaks the diagonal resistance, there's a potential for upward movement in prices. Conversely, if the candle breaks down the diagonal support level, it indicates a possible downward movement in prices. Stop loss and target placement are determined based on the rules of the pattern.
Fibonacci Extension Levels Analysis
Fibonacci extension levels are utilized to identify potential price targets in a trending market. Typically, when the price breaks or sustains above the 0.50 Fibonacci extension level, it suggests a continuation of bullish movement, as supported by various studies. However, it's noted that between the 0.50 and 0.618 Fibonacci extension levels, a "no trading zone" is considered in this analysis. The 0.618 level acts as a critical point where price action may exhibit indecision or consolidation before establishing a clear direction.
These analyses provide valuable insights for making strategy decisions within the Nifty50 chart.
Note: -I am not providing any trading call in this analysis idea, this is my personal view on Nifty 50

Nifty 50 Daily Chart Analysis - February 20, 2024Nifty 50 Daily Chart Analysis - February 20, 2024
Current Status:
The Nifty 50 closed at 22,196.95, up 0.34% from the previous day.
The intraday high was 22,215.60, and the low was 22,045.85.
Trend and Moving Averages:
The daily chart suggests a short-term bullish trend. The index recently broke above the 22,000 resistance level, confirming the uptrend.
All major moving averages (50-day, 100-day, 200-day) are sloping upwards, further confirming the bullish trend.
Technical Indicators:
RSI: The RSI indicator is currently at 68.5, indicating the index is slightly overbought. This suggests a potential pullback in the short term.
MACD: The MACD indicator is above the signal line and trending upwards, indicating bullish momentum. However, the histogram bars are starting to shrink, suggesting weakening momentum.
Support and Resistance:
The nearest support level is around 21,600-21,700, followed by 21,300.
There is no immediate resistance level in sight. However, the psychological level of 22,500 could act as a resistance shortly.
Key Observations:
The breakout above 22,000 is a positive signal for the short term.
Overbought technical indicators suggest a potential pullback before further upside.
Lack of immediate resistance allows for potential price appreciation.
Overall:
The Nifty 50 is currently in a good position with a short-term bullish trend. However, investors should be cautious of potential pullbacks due to overbought technical indicators. Monitoring support and resistance levels and key economic data will be crucial for further analysis.
Disclaimer: This analysis is for informational purposes only and should not be considered financial advice. Please consult with a qualified financial advisor before making any investment decisions.
Additional Notes:
This analysis is based on the closing price and technical indicators. Intraday analysis might provide different insights.
It's important to consider fundamental factors along with technical analysis for a comprehensive understanding of the market.
I hope this enhanced analysis is helpful!

NIFTY 50 viewThere is consolidation phase going on in NIFTY 50 from Jan onwards NIFTY movement restricted as per following range :-
1. 22150 to Upperside.
2. 21164 to downside.
3. No one knows, where market will move in coming days. See the MACD closely, if this crossover happened and RSI breakdown below yellow line, marked with circle, then downside movement can be seen in the NIFTY 50 in Feb or Mar series.
4. So trade is this, Buy NIFTY PE 21200 of Feb or Mar expiry, if NIFTY breakdown below 21200 and sustained well.
5. Buy 22000 PE Jun 2024 @765 with strict stop-loss 600. Tgt open till NIFTY reaches 20300 and 19800.
6. High probability, Market has to correct before Loksabha Election to move further.

Nifty 50 Trend AnalysisIt is moving inside a descending broadening wedge pattern inside a bigger descending broadening wedge pattern highlighted.
Expecting Nifty to hit 16630 level before the last dump towards 14920 level.
16630 level is at the confluence of 50 MA, trendline resistance and the top of the runaway gap which is going to get filled along with strong bearish divergence on Daily RSI.
I have highlighted some of the areas where NIFTY fell sharply after touching 50 MA.
I don't expect we are going below 14900 level because the lower edges of both the wedges and key support trendline are in confluence.
Other macroeconomic factors supporting my view are Dollar Index and INDIAVIX.
Both are expected to give the last push upside, which will mark the bottom for NIFTY 50 and other indices.
Do your own due diligence before taking any action.
Peace!!

"Nifty 50" - "SELL" signal 15 min (Solved Signal 1)-SELL signal generated by "Solved Signal 1(SS1)" in 15 min Chart of " NIFTY 50" Index
- "NIFTY 50" 15 min chart
- Indicator used "Solved Signal 1(SS1)"
-Solved Signal 1 generates SELL signal(by default: text:- SS1, color= red,shape=triangledown)
on 15 min chart of 'NIFTY50 index' .It means NIFTY50 can go down.
-Solved Signal 1 NSE:NIFTY Price data for Solving the Market(See description of Indicator).
-Like and Comment.
-Thankyou
NSE:BANKNIFTY NSE:SBIN NSE:NIFTY BSE:SENSEX

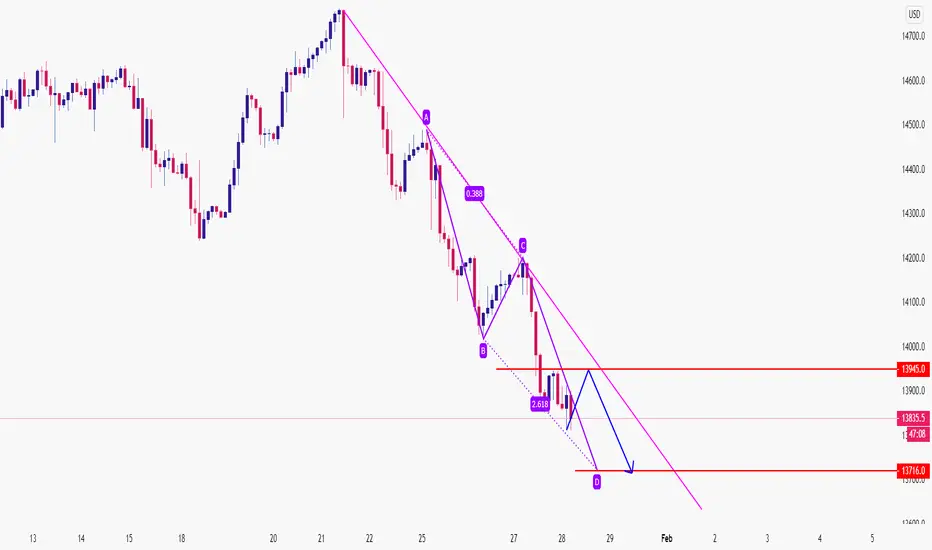
Nifty 50 Intraday Trade Setup for 28th January 2021Good Morning everyone,
Today's analysis is on India 50 because our Nifty has not enough data to show and I have interested more to knows the FIIS positions. India 50 is listed in Oanda and mostly FIIS positions are there. A clear sign that FIIS are started to book their profit. You guys need to understand the differences btw Profit booking and in Sell off. The current downfall is the correction for the previous bull run. According to India 50 13,700 to 13,800 is the first stop the current fall. Remember this is Important support for Nifty 50 as well. Harmonic ABCD pattern is sitting on 13.716 so book your swing position before this level. If Index failed to hold this level then we will see more pain and Index can go to their next support but I strongly believe that Index will respect harmonic prz . A small bounce can be expected.
Trade setup
===============
FIIS in profit booking mode and the Index is going to open with a gap down might be 100-150 points. Due to expiry, there are higher chances to see a recovery from the support. so wait for the first 15 minutes to see the Index direction and take to decide according to it, Go in long position if Index breaks 15-minute candle high and sell if 15-minute candles low break. Stop loss is vice versa and the target is open.
Good luck and have a profitable day ahead
Virendra Pandey
Nifty 50 Intraday Trade Setup for 12th may 2020Good Morning Everyone,
Hope you all are doing good and made some good money in yesterday Trading session. Again Nifty failed to break their 1 week range. Yesterday We had seen a huge gap up opening but Index not sustain above then 9400 and closed on 9239.Index currently Trading in a range from last one week upper side level is 9400 and downside level is 9100. This range is most Important for today Trade setup . Index will give momentum if this range break ... Lets see what is the key factors for today Intraday and what is our technical view for today.
Key Factors
===============
1- SGX looks weak and trading on 9158 which is 56 point lower then previous closing. We aspect 40-50 Gap down in Nifty 50 Index.
2-March IIP and April CPI numbers will be out on Tuesday and they may have an impact on market’s trajectory over the next few sessions.
3- Last 2 Trading session DOW is taking support from 200 EMA in hourly time frame. Index trading on 24040 which is 157 point low from the previous closing and trading again on 200 EMA.
4-Asian markets were little changed as investors await the release of Chinese inflation data expected to be out later in the day. Nikkei 225 was largely flat in early trade while South Korea’s Kospi dipped 0.38%. Meanwhile, the S&P/ASX 200 in Australia slipped 0.67%
5- Crude Oil Prices is steady and rise.
6-Chinese advisers call for talks on new trade deal with US: Report
Technical View
==================
Lets talk first about SGX nifty where our Nifty future trade . SGX has also made a H&S pattern in 2 hour time frame which is show weakens of the Index. Neck Line Level is 9,050 check the bellow Image.
Resistance
==============
Intraday Resistance is on 9400 and Key resistance is on 9,900-10,000
Support
==================
Nifty Intraday support is on 9100 and key support is on 8,900 so shorter keep an eye on 9,100 for Today Trading session
Tuesday 12th May Trade Setup
====================================
Buy : Only and only if Index sustain above then 9,400
Sell : Sell if Index break week range which is lower then 9,100
Disclaimer: I am not a SEBI Registered Research Analyst and all the information provided here is for educational purposes Views are shared based on market research and study and personal in nature. Others can take the different view and opinions.
Good Luck and Happy Trading
Virendra Pandey

Nifty 50 views as the ended 28/10/2024By the last Friday nifty has achieved a target reaching the monthly support zone.
Positionally nifty weekly significant zone is far to near to be breached, in coming week.
Naturally Nifty 50 attempted it with due deligence but in the end failed to achieve it clean.
Bank Nifty the major component of Nifty 50, has all together a different structure monthly and weekly also. Also, it has a pending target of reaching an important monthly support.
Conclusion: There were no surprises in both the indices as such, every thing was normal and within understanding levels.

Nifty 50 Prediction for 22-07-2024: Support & Resistance LevelsIn today's session, Nifty 50 traded within a narrow range, displaying significant stock-specific action in the broader markets, which resulted in healthy market breadth. Despite this, the index failed to close in the green. The setup isn't particularly bullish, making it crucial to observe the market's reaction to the Budget.
Factors Influencing Nifty Prediction for Tomorrow:
Budget Impact: The recent Union Budget might have influenced market sentiment.
Global Market Trends: Performance in overseas markets, especially in the US and Europe, can affect domestic indices.
Economic Indicators: Key economic data releases can impact investor confidence.
Result Season: Corporate earnings announcements can lead to stock-specific movements, influencing the overall index.
Support and Resistance Levels:
Support: 24,200 to 24,150, as indicated in previous analysis.
Resistance: On the upside, 24,595 acts as the first resistance. The index needs to surpass the high of 24,855 from Friday to negate the current pattern. Failing to do so might lead to a corrective phase post the event.
The market is expected to be highly volatile in the second half, with subdued activity in the first half until the budget speech concludes.
Technical Indicators for Nifty Prediction:
Max Pain: 24,500
PCR (Put-Call Ratio): 0.89
IV (Implied Volatility): 23.69 as of the closing on 22-07-2024.
Verdict: Given the higher premiums, the market is likely to attempt to decay these premiums before establishing a trend.
By monitoring these factors, traders can make informed decisions regarding Nifty 50 and prepare for possible market movements based on the Nifty prediction for tomorrow.
Disclosure: I am not SEBI registered. The information provided is for educational purposes only and should not be considered financial advice. Consult a qualified financial advisor before making any investment decisions. Social media shares are neither advice nor endorsed by the publisher.

Bullish on Nifty equal weight relative to Nifty 50?Nifty 50 Equal Weight index to Nifty 50 index relative strength (NIFTY50EQUALWEIGHT/NIFTY) chart seems to have broken out of an ascending triangle type consolidation on the weekly time scale.
The price action on the relative strength chart has broken out of the consolidation and has completed the retracement on the support/resistance zone. Will we see a continuation of the bullish breakout?
If the breakout is successful, we are likely to see bullish price action on PSEs, PSU Banks, Pharma, and Metal stocks while Banks and IT stocks are likely to face headwinds.

Nifty 50: Bearish Trend with Key Support LevelsOverview of the Chart:
The chart represents the daily candlestick pattern for the Nifty 50 index, combined with the following indicators and tools:
ZLMA (Zero Lag Moving Average) for 50 and 100 periods.
Fibonacci Retracement Levels drawn from the most recent high to low.
RSI (Relative Strength Index) to measure momentum and overbought/oversold conditions.
MACD (Moving Average Convergence Divergence) to analyze momentum and trend direction.
ZLMA (Zero Lag Moving Averages):
50 ZLMA (Black Line): This represents the short-term trend. The index is currently trading below this moving average, indicating bearish momentum in the short term.
100 ZLMA (Blue Line): This acts as a long-term trend indicator. The index is also below this level, signaling a weakening trend in the medium to long term.
The convergence of these two ZLMAs suggests a key resistance zone around the 24,000–24,150 range. Until the price breaks above these levels, the overall bias remains bearish.
Fibonacci Retracement Analysis:
The Fibonacci retracement levels are drawn between the recent swing high of 26,282.35 and swing low of 21,296.50. Key levels:
23.6% Retracement (25,105.70): This acted as resistance during earlier retracements and failed to hold.
38.2% Retracement (24,377.75): Another resistance level where the price struggled and has recently broken down.
50% Retracement (23,789.40): The index is now below this level, which may act as immediate resistance.
61.8% Retracement (23,201.10): The current level is hovering close to this support. If breached, the next target would be the 78.6% retracement (22,363.45).
The inability to reclaim higher Fibonacci levels reinforces the bearish trend.
RSI (Relative Strength Index):
Current RSI: 35.05, below the neutral level of 50.
The RSI is nearing the oversold region (below 30), which might indicate a potential bounce. However, this is not confirmed yet, as momentum remains weak.
Previous RSI divergence patterns do not suggest immediate reversal signals.
MACD (Moving Average Convergence Divergence):
MACD Line (-173.87) is well below the signal line (-235.40), confirming the bearish momentum.
The histogram bars remain negative, showing no signs of reversal yet.
The MACD's placement suggests that the bearish phase is intact and any uptrend might be corrective.
Volume Analysis:
The volume appears consistent but does not show any significant spikes. This suggests a lack of strong buyer interest at the current levels.
Declining volume during pullbacks indicates weak bullish attempts.
Current Levels to Watch:
Support Levels: 23,201.10 (61.8% Fibonacci) and 22,363.45 (78.6% Fibonacci).
Resistance Levels: 23,789.40 (50% Fibonacci), followed by 24,150 (near the ZLMA 50 and 100).
Conclusion:
The Nifty 50 index is in a bearish phase, trading below its key moving averages and important Fibonacci levels. The RSI and MACD confirm the negative sentiment. However, the proximity to the 61.8% Fibonacci retracement level and oversold RSI suggests that there might be a short-term bounce, especially if 23,201.10 holds as support. A failure to hold this level would open the doors for a deeper correction towards 22,363.45.
Traders should closely watch volume and price action near these support and resistance levels to further confirmation of trend direction.
Note:
Studies are for educational purposes only.
We will not be responsible for any of your Profits & Losses.
Please trade with a proper risk management strategy to avoid huge capital loss.
